Investor Relations
-
Construction Engineering
-
Real Estate Development
-
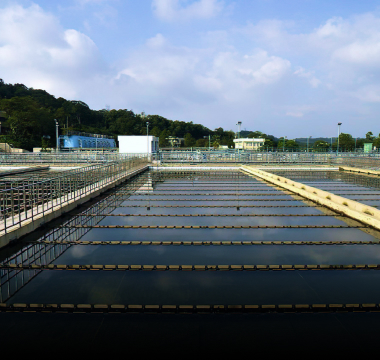
Environmental Project Development & Water Treatment
| UNIT: $NT million | 1Q4 | 2Q4 | 3Q4 | 4Q4 |
|---|---|---|---|---|
| Construction Engineering |
4,046
65.7%
|
4,581
52.8%
|
4,588
56.0%
|
4,675
61.0%
|
| Real Estate Development |
806
13.1%
|
2,412
27.8%
|
1,141
13.9%
|
580
7.6%
|
| Environmental Project Development & Water Treatment |
1,308
21.2%
|
1,691
19.5%
|
2,461
30.1%
|
2,411
31.5%
|
| Total revenues |
6,161
100%
|
8,684
100%
|
8,190
100%
|
7,666
100%
|
Note 1 :
2024 consolidated revenues of member companies, CEC, CDC and HDEC are NT$20,980 million, NT$4,939 million and NT$7,872 million respectively.
Note 2 :
The information contained within this page is for information purpose only. It is not, and may not be relied on in any manner, as legal, tax or investment advice. Nor is it an authorized offer to sell or a solicitation of an offer to buy an interest in any investment. In no event shall CHC be responsible for any direct or indirect damage or loss arising out of or in connection with the use of this information.
-
Construction Engineering
-
Real Estate Development
-
Environmental Project Development & Water Treatment
| UNIT: $NT million | 1Q23 | 2Q23 | 3Q23 | 4Q23 |
|---|---|---|---|---|
| Construction Engineering |
4,123
61.8%
|
4,919
60.7%
|
4,540
58.2%
|
5,079
63.1%
|
| Real Estate Development |
1,699
25.5%
|
2,134
26.3%
|
1,806
23.2%
|
1,529
19.0%
|
| Environmental Project Development & Water Treatment |
848
12.7%
|
1,047
12.9%
|
1,448
18.6%
|
1,436
17.9%
|
| Total revenues |
6,669
100%
|
8,100
100%
|
7,794
100%
|
8,044
100%
|
Note 1 :
2023 consolidated revenues of member companies, CEC, CDC and HDEC are NT$20,863 million, NT$7,167 million and NT$4,779 million respectively.
Note 2 :
The information contained within this page is for information purpose only. It is not, and may not be relied on in any manner, as legal, tax or investment advice. Nor is it an authorized offer to sell or a solicitation of an offer to buy an interest in any investment. In no event shall CHC be responsible for any direct or indirect damage or loss arising out of or in connection with the use of this information.
-
Construction Engineering
-
Real Estate Development
-
Environmental Project Development & Water Treatment
| UNIT: $NT million | 1Q22 | 2Q22 | 3Q22 | 4Q22 |
|---|---|---|---|---|
| Construction Engineering |
4,231
42.2%
|
4,108
49.8%
|
4,116
66.2%
|
5,547
72.3%
|
| Real Estate Development |
4,621
46.1%
|
3,055
37.1%
|
786
12.6%
|
976
12.7%
|
| Environmental Project Development & Water Treatment |
1,171
11.7%
|
1,078
13.1%
|
1,312
21.1%
|
1,144
14.9%
|
| Total revenues |
10,023
100%
|
8,241
100%
|
6,214
100%
|
7,667
100%
|
Note 1 :
2022 consolidated revenues of member companies, CEC, CDC and HDEC are NT$19,553 million, NT$9,438 million and NT$4,705 million respectively.
Note 2 :
The information contained within this page is for information purpose only. It is not, and may not be relied on in any manner, as legal, tax or investment advice. Nor is it an authorized offer to sell or a solicitation of an offer to buy an interest in any investment. In no event shall CHC be responsible for any direct or indirect damage or loss arising out of or in connection with the use of this information.
-
Construction Engineering
-
Real Estate Development
-
Environmental Project Development & Water Treatment
| UNIT: $NT million | 1Q21 | 2Q21 | 3Q21 | 4Q21 |
|---|---|---|---|---|
| Construction Engineering |
3,150
49.6%
|
3,930
70.3%
|
3,850
71.9%
|
4,335
45.4%
|
| Real Estate Development |
2,105
33.1%
|
900
16.1%
|
859
16.1%
|
4,187
43.9%
|
| Environmental Project Development & Water Treatment |
1,098
17.3%
|
761
13.6%
|
643
12.0%
|
1,025
10.7%
|
| Total revenues |
6,353
100%
|
5,591
100%
|
5,352
100%
|
9,547
100%
|
Note 1 :
2022 consolidated revenues of member companies, CEC, CDC and HDEC are NT$19,553 million, NT$9,438 million and NT$4,705 million respectively.
Note 2 :
The information contained within this page is for information purpose only. It is not, and may not be relied on in any manner, as legal, tax or investment advice. Nor is it an authorized offer to sell or a solicitation of an offer to buy an interest in any investment. In no event shall CHC be responsible for any direct or indirect damage or loss arising out of or in connection with the use of this information.
-
Construction Engineering
-
Real Estate Development
-
Environmental Project Development & Water Treatment
| UNIT: $NT million | 1Q20 | 2Q20 | 3Q20 | 4Q20 |
|---|---|---|---|---|
| Construction Engineering |
2,933
67.6%
|
2,992
65.1%
|
3,226
56.5%
|
3,601
51.1%
|
| Real Estate Development |
820
18.9%
|
834
18.1%
|
1,647
28.8%
|
2,529
35.9%
|
| Environmental Project Development & Water Treatment |
587
13.5%
|
772
16.8%
|
836
14.6%
|
911
12.9%
|
| Total revenues |
4,340
100%
|
4,598
100%
|
5,709
100%
|
7,041
100%
|
Note 1 :
2022 consolidated revenues of member companies, CEC, CDC and HDEC are NT$19,553 million, NT$9,438 million and NT$4,705 million respectively.
Note 2 :
The information contained within this page is for information purpose only. It is not, and may not be relied on in any manner, as legal, tax or investment advice. Nor is it an authorized offer to sell or a solicitation of an offer to buy an interest in any investment. In no event shall CHC be responsible for any direct or indirect damage or loss arising out of or in connection with the use of this information.
| Month | Amount (Unit: $NT thousand) |
|---|---|
| January | 2,357,346 |
| February | 2,459,226 |
| March | 2,586,309 |
| April | |
| May | |
| June | |
| July | |
| August | |
| September | |
| October | |
| November | |
| December | |
| Total | 7,402,881 |
| Month | Amount (Unit: $NT thousand) |
|---|---|
| January | 2,107,731 |
| February | 1,716,453 |
| March | 2,336,765 |
| April | 2,765,070 |
| May | 2,858,248 |
| June | 3,060,694 |
| July | 3,072,958 |
| August | 2,550,226 |
| September | 2,566,797 |
| October | 2,548,416 |
| November | 2,660,844 |
| December | 2,450,370 |
| Total | 30,694,572 |
| Month | Amount (Unit: $NT thousand) |
|---|---|
| January | 2,091,980 |
| February | 2,136,268 |
| March | 2,441,035 |
| April | 2,639,327 |
| May | 2,635,496 |
| June | 2,825,281 |
| July | 2,101,212 |
| August | 2,593,735 |
| September | 3,098,964 |
| October | 2,648,919 |
| November | 2,713,706 |
| December | 2,688,035 |
| Total | 30,613,958 |
| Month | Amount (Unit: $NT thousand) |
|---|---|
| January | 2,728,982 |
| February | 3,228,857 |
| March | 4,065,207 |
| April | 2,471,889 |
| May | 3,022,304 |
| June | 2,746,937 |
| July | 2,009,945 |
| August | 2,084,366 |
| September | 2,118,905 |
| October | 3,039,310 |
| November | 2,048,219 |
| December | 2,561,108 |
| Total | 32,126,029 |
| Month | Amount (Unit: $NT thousand) |
|---|---|
| January | 2,331,733 |
| February | 1,675,035 |
| March | 2,345,916 |
| April | 2,003,938 |
| May | 1,964,409 |
| June | 1,623,667 |
| July | 1,599,063 |
| August | 1,607,276 |
| September | 2,145,587 |
| October | 2,909,046 |
| November | 3,560,455 |
| December | 3,077,837 |
| Total | 26,843,962 |
| Month | Amount (Unit: $NT thousand) |
|---|---|
| January | 1,808,202 |
| February | 1,062,686 |
| March | 1,468,468 |
| April | 1,428,462 |
| May | 1,569,307 |
| June | 1,600,888 |
| July | 1,988,462 |
| August | 1,811,746 |
| September | 1,908,530 |
| October | 1,811,323 |
| November | 1,868,507 |
| December | 3,362,067 |
| Total | 21,688,648 |
| Month | Amount (Unit: $NT thousand) |
|---|---|
| January | 2,021,686 |
| February | 1,276,686 |
| March | 1,668,477 |
| April | 2,448,419 |
| May | 2,628,313 |
| June | 1,933,868 |
| July | 2,050,553 |
| August | 1,377,401 |
| September | 1,667,040 |
| October | 1,571,880 |
| November | 1,838,119 |
| December | 2,182,645 |
| Total | 22,665,087 |
| Month | Amount (Unit: $NT thousand) |
|---|---|
| January | 2,803,834 |
| February | 1,745,841 |
| March | 2,027,551 |
| April | 1,718,484 |
| May | 2,212,648 |
| June | 1,807,632 |
| July | 1,768,002 |
| August | 2,287,956 |
| September | 2,303,398 |
| October | 1,874,202 |
| November | 2,180,453 |
| December | 2,306,808 |
| Total | 25,036,809 |
| Month | Amount (Unit: $NT thousand) |
|---|---|
| January | 2,329,500 |
| February | 1,523,135 |
| March | 1,946,941 |
| April | 1,952,482 |
| May | 1,958,308 |
| June | 2,059,892 |
| July | 2,266,865 |
| August | 1,953,580 |
| September | 2,657,300 |
| October | 2,681,279 |
| November | 3,024,551 |
| December | 3,852,924 |
| Total | 28,206,757 |
| Month | Amount (Unit: $NT thousand) |
|---|---|
| January | 5,266,582 |
| February | 1,216,486 |
| March | 1,544,635 |
| April | 1,462,425 |
| May | 1,383,403 |
| June | 1,553,251 |
| July | 1,317,291 |
| August | 1,388,922 |
| September | 1,215,039 |
| October | 1,499,330 |
| November | 1,208,754 |
| December | 2,979,723 |
| Total | 22,035,841 |


